
Robohub.org
Motor control systems: Bode plots and stability
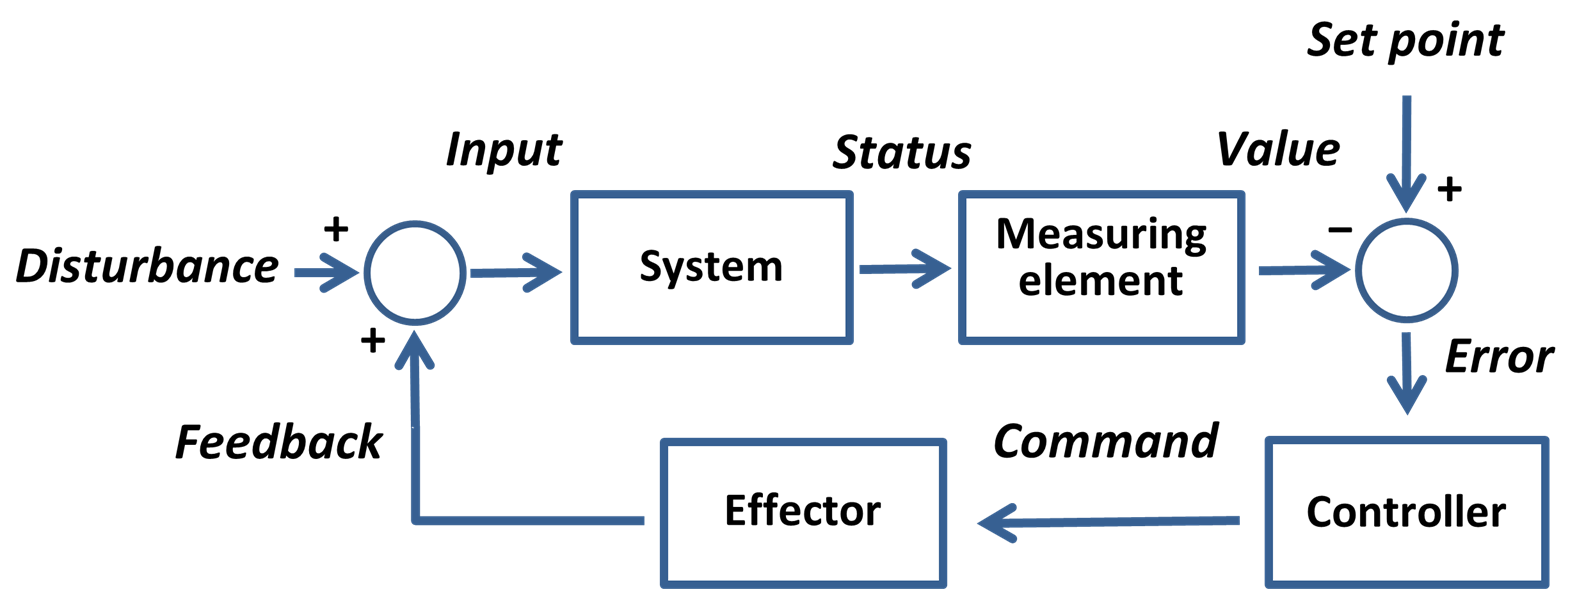
Set point control: Image: Wikipedia Commons
I was asked on the Robots for Roboticists forum about tuning motors and understanding Bode plots. Many motor control software packages come with tuning tools that can generate Bode plots. This post is my response to that question.
What is a control system? A control system alters the future state of its system to a more desirable outcome. We often work with feedback control systems (also called closed-loop control), where the result of the command is fed back into the control system. In particular, we are looking for the error between the command and the desired response. If the output state is not fed back into the control system it is referred to as an open loop system.
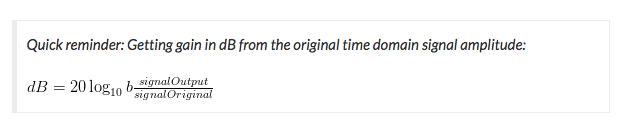
The frequency of a system can be hard to visualize just by watching the motors motion. The frequency of the system is when you convert the time domain signal (ie. you look at the motors motion over time), and convert it into the frequency domain using a Fourier transform. Once you convert the signal into the frequency domain we can use Bode plots. Bode plots help us visualize (the transfer function) of a control system response and to verify its stability.
Random Note:
Assuming you know the transfer function, in an open loop system you can just use root finding (ie. finding the values that make the equation equal to 0) to check stability (by making sure that all roots are negative real values). For feedback based closed loop system we can modify the above and solve with a computer (since math is hard), or use the Bode plot to help understand the control system better. (I should also point out you can use Routh-Hurwitz to avoid the complex math, this will need to be another post…)
In general, the Bode plots are showing the phase and gain (magnitude) from your input control signal until it reaches the output (command) in the frequency domain.
Parts of the Bode Plot
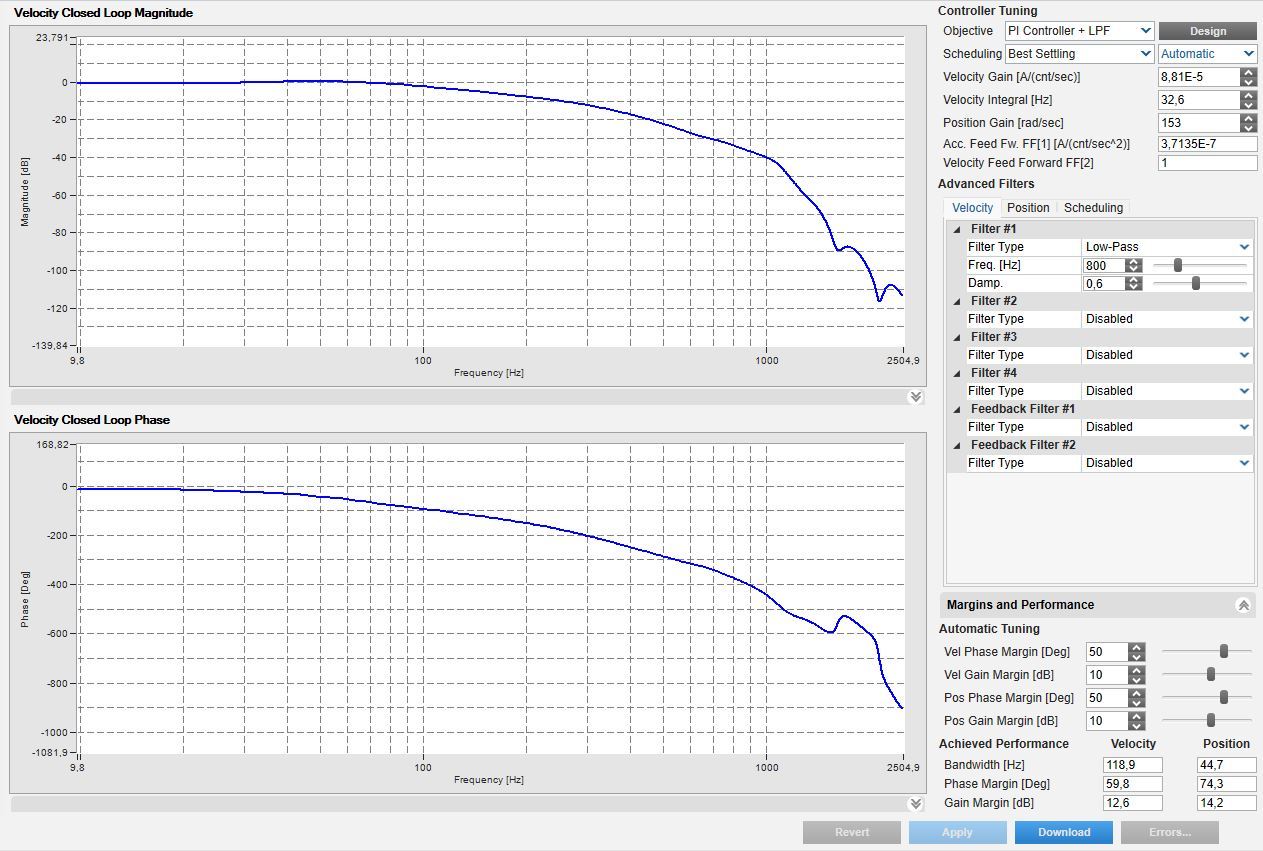
Gain is the shift in value between the input signal and resultant command. If you had a system with no gain and no losses, then you would have a straight horizontal line with 0dB of gain. You will usually see the gain drop off (decrease) on the right side of the magnitude plot. The larger the frequency range until it starts dropping off, shows a system that will be stable in more conditions. Random bumps and curves in the main curve are often signs of instability. If the gain increases anywhere to infinity (ie. large values) that is often a sign of instability, and you need to rethink your controller settings! If you have spikes in gain see the filtering section below.
Bandwidth is the area from the top of the curve until the magnitude degrades by -3dB. So in the image above you can see the curve dropping at around 100Hz. So the bandwidth of your system is around 100Hz. This tool actually shows the exact bandwidth value of 118.9Hz in the box at the lower right of the image. Controls past 118.9Hz will by sluggish or unresponsive.
Phase describes the time shift between the input signal and the output command. A phase of 360 is for a single cycle. So if you have a 1KHz (ie 1000Hz) command signal each 360 degrees in the chart would represent 1/1000 of a second (converting frequency to time) or 1 millisecond. You can see in the phase diagram that once you exceed the bandwidth it will take longer for the desired input signal to be transferred to the output signal.
Filtering specific frequencies
Various filters (low-pass, notch, etc..) are often applied to remove a resonance at a specific frequency. For example, if you spin a motor and you see at a specific frequency things start to shake violently, you can add a filter so the gain will be reduced at that frequency. In general, you should tune a motor with no filters, and only add the filters if needed.
Verifying control parameters
You can verify that the selected gains are good by looking at the output waveform when a step command is applied (in the time domain); this is sometimes referred to as oscilloscope mode. If there is a lot of initial ringing (constant changing) or overshoot in the beginning of motion your gains are probably too high. If the initial command is slowly reaching the desired output you might need to increase your gains.
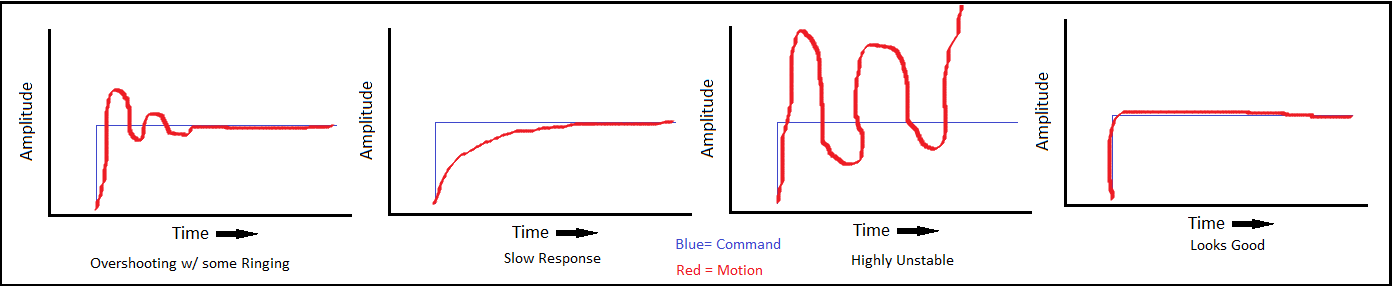
Plots showing common tuning problems followed by a good response curve. The blue lines are the command, and the red lines are the actual motor output.
In the image above starting from the left we can see:
1. Overshooting of the output motion, with a little signal ringing as it settles to the command. A little overshoot is often fine, but we do try to minimize overshoot while still having a responsive system.
2. Slow response of the output. We might want a faster response so the system will be less sluggish. As you make the system less sluggish you often increase the overshooting and potential for instability.
3. Highly unstable. Starts with a bunch of oscillation, followed by a large spike in command output. We want to avoid this!
4. Finally this right-most plot looks good. The motor output is directly on top of the commanded motion, with a very slight overshoot (if you look close).
For more information on tuning controllers visit my post on PID Controllers.
Also while I talk a lot about motors, most of the above works for any control system and does not necessarily need to be a motor.
I want to thank MC_Newbie on the forum for this question.
tags: robots for roboticists

AUAI is supported by: